| dc.contributor.author | Palenik, Juraj | |
| dc.contributor.author | Spengler, Thomas | |
| dc.contributor.author | Hauser, Helwig | |
| dc.date.accessioned | 2021-05-05T10:39:05Z | |
| dc.date.available | 2021-05-05T10:39:05Z | |
| dc.date.created | 2020-12-09T15:34:53Z | |
| dc.date.issued | 2020 | |
| dc.identifier.issn | 1077-2626 | |
| dc.identifier.uri | https://hdl.handle.net/11250/2753652 | |
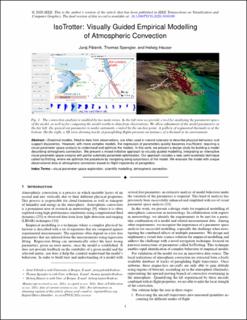
| dc.description.abstract | Empirical models, fitted to data from observations, are often used in natural sciences to describe physical behaviour and support discoveries. However, with more complex models, the regression of parameters quickly becomes insufficient, requiring a visual parameter space analysis to understand and optimize the models. In this work, we present a design study for building a model describing atmospheric convection. We present a mixed-initiative approach to visually guided modelling, integrating an interactive visual parameter space analysis with partial automatic parameter optimization. Our approach includes a new, semi-automatic technique called IsoTrotting, where we optimize the procedure by navigating along isocontours of the model. We evaluate the model with unique observational data of atmospheric convection based on flight trajectories of paragliders. | en_US |
| dc.language.iso | eng | en_US |
| dc.publisher | IEEE | en_US |
| dc.title | IsoTrotter: Visually Guided Empirical Modelling of Atmospheric Convection | en_US |
| dc.type | Journal article | en_US |
| dc.type | Peer reviewed | en_US |
| dc.description.version | acceptedVersion | en_US |
| dc.rights.holder | Copyright 2020 IEEE | en_US |
| cristin.ispublished | true | |
| cristin.fulltext | postprint | |
| cristin.qualitycode | 2 | |
| dc.identifier.doi | 10.1109/TVCG.2020.3030389 | |
| dc.identifier.cristin | 1858033 | |
| dc.source.journal | IEEE Transactions on Visualization and Computer Graphics | en_US |
| dc.source.pagenumber | 775 - 784 | en_US |
| dc.identifier.citation | IEEE Transactions on Visualization and Computer Graphics. 2020, 27(2), 775 - 784 | en_US |
| dc.source.volume | 27 | en_US |
| dc.source.issue | 2 | en_US |