Ways of knowing with data visualizations
| dc.contributor.author | Rettberg, Jill Walker | |
| dc.contributor.editor | Engebretsen, Martin | |
| dc.contributor.editor | Kennedy, Helen | |
| dc.date.accessioned | 2021-04-21T10:39:55Z | |
| dc.date.available | 2021-04-21T10:39:55Z | |
| dc.date.created | 2020-05-23T14:37:29Z | |
| dc.date.issued | 2020 | |
| dc.identifier.isbn | 978-90-4854-313-7 | |
| dc.identifier.uri | https://hdl.handle.net/11250/2738846 | |
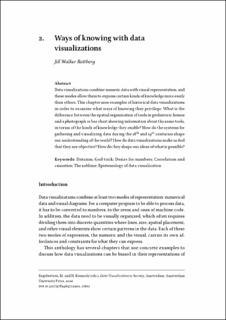
| dc.description.abstract | Data visualizations combine numeric data with visual representation, and these modes allow them to express certain kinds of knowledge more easily than others. This chapter uses examples of historical data visualizations in order to examine what ways of knowing they privilege. What is the difference between the spatial organization of tools in prehistoric homes and a photograph or bar chart showing information about the same tools, in terms of the kinds of knowledge they enable? How do the systems for gathering and visualizing data during the 18th and 19th centuries shape our understanding of the world? How do data visualizations make us feel that they are objective? How do they shape our ideas of what is possible? | en_US |
| dc.language.iso | eng | en_US |
| dc.publisher | Amsterdam University Press | en_US |
| dc.relation.ispartof | Data Visualization in Society | |
| dc.relation.uri | http://library.oapen.org/bitstream/handle/20.500.12657/22273/9789048543137.pdf?sequence=1#page=36 | |
| dc.rights | Attribution-NonCommercial-NoDerivatives 4.0 Internasjonal | * |
| dc.rights.uri | http://creativecommons.org/licenses/by-nc-nd/4.0/deed.no | * |
| dc.subject | Informasjonsvisualisering | en_US |
| dc.subject | Information visualization | en_US |
| dc.subject | Visuell kommunikasjon | en_US |
| dc.subject | Visual comunication | en_US |
| dc.title | Ways of knowing with data visualizations | en_US |
| dc.type | Chapter | en_US |
| dc.description.version | publishedVersion | en_US |
| dc.rights.holder | Copyright 2020 Amsterdam University Press | en_US |
| cristin.ispublished | true | |
| cristin.fulltext | original | |
| cristin.qualitycode | 1 | |
| dc.identifier.doi | https://doi.org/10.2307/j.ctvzgb8c7.8 | |
| dc.identifier.cristin | 1812235 | |
| dc.source.pagenumber | 35-48 | en_US |
| dc.relation.project | Norges forskningsråd: 259536 | en_US |
| dc.subject.nsi | VDP::Humaniora: 000 | en_US |
| dc.subject.nsi | VDP::Humanities: 000 | en_US |
| dc.identifier.citation | In Engebretsen M. & Kennedy H. (Eds.), Data Visualization in Society (pp. 35-48) | en_US |
Files in this item
This item appears in the following Collection(s)

Except where otherwise noted, this item's license is described as Attribution-NonCommercial-NoDerivatives 4.0 Internasjonal