Honeycomb Plots: Visual Enhancements for Hexagonal Maps
| dc.contributor.author | Trautner, Thomas Bernhard | |
| dc.contributor.author | Sbardellati, Maximilian | |
| dc.contributor.author | Stoppel, Sergej | |
| dc.contributor.author | Bruckner, Stefan | |
| dc.date.accessioned | 2022-10-10T12:58:27Z | |
| dc.date.available | 2022-10-10T12:58:27Z | |
| dc.date.created | 2022-10-04T14:26:13Z | |
| dc.date.issued | 2022 | |
| dc.identifier.isbn | 978-3-03868-189-2 | |
| dc.identifier.uri | https://hdl.handle.net/11250/3025145 | |
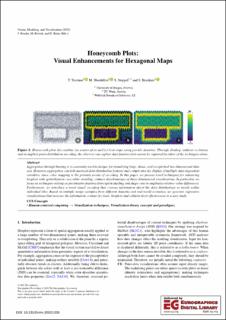
| dc.description.abstract | Aggregation through binning is a commonly used technique for visualizing large, dense, and overplotted two-dimensional data sets. However, aggregation can hide nuanced data-distribution features and complicates the display of multiple data-dependent variables, since color mapping is the primary means of encoding. In this paper, we present novel techniques for enhancing hexplots with spatialization cues while avoiding common disadvantages of three-dimensional visualizations. In particular, we focus on techniques relying on preattentive features that exploit shading and shape cues to emphasize relative value differences. Furthermore, we introduce a novel visual encoding that conveys information about the data distributions or trends within individual tiles. Based on multiple usage examples from different domains and real-world scenarios, we generate expressive visualizations that increase the information content of classic hexplots and validate their effectiveness in a user study. | en_US |
| dc.language.iso | eng | en_US |
| dc.publisher | Eurographics - European Association for Computer Graphics | en_US |
| dc.rights | Navngivelse 4.0 Internasjonal | * |
| dc.rights.uri | http://creativecommons.org/licenses/by/4.0/deed.no | * |
| dc.title | Honeycomb Plots: Visual Enhancements for Hexagonal Maps | en_US |
| dc.type | Chapter | en_US |
| dc.description.version | publishedVersion | en_US |
| dc.rights.holder | Copyright 2022 The Author(s) | en_US |
| cristin.ispublished | true | |
| cristin.fulltext | original | |
| cristin.qualitycode | 1 | |
| dc.identifier.doi | https://doi.org/10.2312/vmv.20221205 | |
| dc.identifier.cristin | 2063557 | |
| dc.source.pagenumber | 9 | en_US |
| dc.identifier.citation | In: J. Bender, M. Botsch, and D. Keim (Eds.). Vision, Modeling, and Visualization. 2022 | en_US |
Tilhørende fil(er)
Denne innførselen finnes i følgende samling(er)
-
Department of Informatics [917]
-
Registrations from Cristin [9489]

Med mindre annet er angitt, så er denne innførselen lisensiert som Navngivelse 4.0 Internasjonal