| dc.contributor.author | Jansson, Ragnhild Wivestad | en_US |
| dc.contributor.author | Ræder, Maria B. | en_US |
| dc.contributor.author | Krohn, Jørgen Gitlesen | en_US |
| dc.date.accessioned | 2016-02-25T09:25:25Z | |
| dc.date.available | 2016-02-25T09:25:25Z | |
| dc.date.issued | 2015-07 | |
| dc.Published | Graefe's Archives for Clinical and Experimental Ophthalmology 2015, 253(7):989-997 | eng |
| dc.identifier.issn | 0721-832X | |
| dc.identifier.uri | https://hdl.handle.net/1956/11360 | |
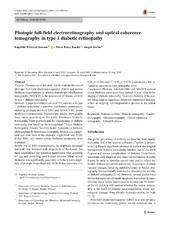
| dc.description.abstract | Purpose: The purpose of this study was to evaluate the role of photopic full-field electroretinography (ERG) and retinal thickness measurements by spectral-domain optical coherence tomography (SD-OCT) in the assessment of disease severity in type 1 diabetic retinopathy. Methods: A population-based cohort of 151 patients with type 1 diabetes underwent a complete ophthalmic examination, including photopic full-field ERG and SD-OCT for retinal thickness measurements. Stereoscopic fundus photographs were taken according to the Early Treatment Diabetic Retinopathy Study protocol, and the classification of diabetic retinopathy was based on the International Clinical Diabetic Retinopathy Disease Severity Scale. Associations between photographically determined retinopathy level, b-wave amplitude and peak time of the photopic single-flash and 30-Hz flicker ERG, and central retinal thickness parameters were evaluated. Results: For all ERG measurements, the amplitude decreased and peak time increased with progression of the disease, but these associations lost statistical significance after adjusting for age and excluding laser-treated patients. Mean retinal thickness was significantly associated with the b-wave amplitude of photopic single-flash and 30-Hz flicker responses (r2 = 0.08, p = 0.006; and r2 = 0.05, p = 0.025, respectively), but revealed no association with retinopathy level. Conclusions: Photopic full-field ERG and SD-OCT-derived retinal thickness parameters have limited clinical value in the staging of diabetic retinopathy. However, thinning of the central retina leads to significant functional impairment and may reflect an ongoing neurodegenerative process in the retinal tissue. | en_US |
| dc.language.iso | eng | eng |
| dc.publisher | Springer | eng |
| dc.rights | Attribution CC BY | eng |
| dc.rights.uri | http://creativecommons.org/licenses/by/4.0 | eng |
| dc.subject | Diabetes mellitus | eng |
| dc.subject | Diabetic retinopathy | eng |
| dc.subject | Fundus photography | eng |
| dc.subject | Electroretinography | eng |
| dc.subject | Optical coherence tomography | eng |
| dc.subject | Retinal thickness | eng |
| dc.title | Photopic full-field electroretinography and optical coherence tomography in type 1 diabetic retinopathy | en_US |
| dc.type | Peer reviewed | |
| dc.type | Journal article | |
| dc.date.updated | 2015-11-09T14:28:58Z | |
| dc.description.version | publishedVersion | en_US |
| dc.rights.holder | Copyright 2015 The Authors | |
| dc.identifier.doi | https://doi.org/10.1007/s00417-015-3034-y | |
| dc.identifier.cristin | 1254571 | |
| dc.subject.nsi | VDP::Medisinske fag: 700::Klinisk medisinske fag: 750::Endokrinologi: 774 | |
| dc.subject.nsi | VDP::Midical sciences: 700::Clinical medical sciences: 750::Endocrinology: 774 | |
| dc.subject.nsi | VDP::Medisinske fag: 700::Klinisk medisinske fag: 750::Oftalmologi: 754 | |
| dc.subject.nsi | VDP::Midical sciences: 700::Clinical medical sciences: 750::Ophthalmology: 754 | |

