| dc.contributor.author | Schwinger, Catherine | en_US |
| dc.contributor.author | Fadnes, Lars Thore | en_US |
| dc.contributor.author | Shrestha, Sanjaya Kumar | en_US |
| dc.contributor.author | Shrestha, Prakash Sunder | en_US |
| dc.contributor.author | Chandyo, Ram Krishna | en_US |
| dc.contributor.author | Shrestha, Binob | en_US |
| dc.contributor.author | Ulak, Manjeswori | en_US |
| dc.contributor.author | Bodhidatta, Ladaporn | en_US |
| dc.contributor.author | Mason, Carl J. | en_US |
| dc.contributor.author | Strand, Tor A. | en_US |
| dc.date.accessioned | 2018-01-17T08:12:21Z | |
| dc.date.available | 2018-01-17T08:12:21Z | |
| dc.date.issued | 2017 | |
| dc.Published | Schwinger C, Fadnes LT, Shrestha SK, Shrestha PS, Chandyo RK, Shrestha B, Ulak M, Bodhidatta L, Mason CJ, Strand TA. Predicting undernutrition at age 2 years with early attained weight and length compared with weight and length velocity . Journal of Pediatrics. 2017;182:127-132.e1 | eng |
| dc.identifier.issn | 0022-3476 | |
| dc.identifier.uri | https://hdl.handle.net/1956/17225 | |
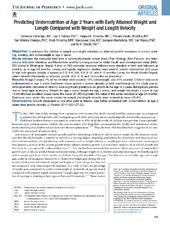
| dc.description.abstract | Objective: To estimate the abilities of weight and length velocities vs attained growth measures to predict stunting, wasting, and underweight at age 2 years. Study design: We analyzed data from a community-based cohort study (The Etiology, Risk Factors, and Interactions of Enteric Infections and Malnutrition and the Consequences for Child Health and Development study [MAL-ED] study) in Bhaktapur, Nepal. A total of 240 randomly selected children were enrolled at birth and followed up monthly up to age 24 months. Linear and logistic regression models were used to predict malnutrition at 2 years of age with growth velocity z scores at 0-3, 0-6, 3-6, 6-9, 6-12, and 9-12 months (using the World Health Organization Growth Standards) or attained growth at 0, 3, 6, and 12 months as predictors. Results: At age 2 years, 4% of the children were wasted, 13% underweight, and 21% stunted. Children who were malnourished at age 2 years had lower mean growth z scores already at birth and throughout the study period. Anthropometric indicators in infancy were significant predictors for growth at the age of 2 years during most periods and at most ages in infancy. Weight-for-age z score, length-for-age z score, and weight-for-length z score at age 12 months had excellent areas under the curve (91-95) to predict the value of the same indicator at age 24 months. Maximum area under the curve values for weight and length velocity were somewhat lower (70-84). Conclusions: Growth measured at one time point in infancy was better correlated with undernutrition at age 2 years than growth velocity. | en_US |
| dc.language.iso | eng | eng |
| dc.publisher | Elsevier | eng |
| dc.relation.ispartof | <a href="http://hdl.handle.net/1956/17271" target="blank"> Growth velocity of young children in two low-resource settings. Patterns and abilities to predict negative health outcomes</a> | |
| dc.title | Predicting undernutrition at age 2 years with early attained weight and length compared with weight and length velocity | en_US |
| dc.type | Peer reviewed | |
| dc.type | Journal article | |
| dc.date.updated | 2018-01-17T08:01:12Z | |
| dc.description.version | publishedVersion | en_US |
| dc.rights.holder | Copyright 2016 The Authors | |
| dc.identifier.doi | https://doi.org/10.1016/j.jpeds.2016.11.013 | |
| dc.identifier.cristin | 1421045 | |
