Heat and Mass Transfer Laws for Turbulent Convective Flows in the Atmosphere over Leads in Ice Covered Oceans, C32A-1123, American Geophysical Union (AGU) Fall Meeting, 5-9 December, San-Francisco, USA
Conference poster
Permanent lenke
https://hdl.handle.net/1956/3815Utgivelsesdato
2005Metadata
Vis full innførselSamlinger
Sammendrag
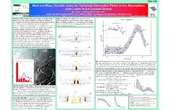
Patches of open water (cracks, leads and polynias, Figure 1) in theice cover give major contributions to turbulent exchanges of heat, moisture, CO2 and other gases between the atmosphere and Polar oceans. Here, convective wind flows over leads (Figure 2) are investigated through numerical large-eddy simulations (LES, Figure 3), scaling theoretical analyses (Figure 4) –to estimate basic parameters of turbulence, namely, convective wind speed, depths-scales of convective zones, horizontal extension of circulations and turbulent fluxes at the air-water interface. The model allowed deriving a heat/mass transfer law for a heat island, which expresses analytically the turbulent fluxes of heat and water vapour from the water surface to the atmosphere through external parameters: the temperature difference between the open water and the ambient air over surrounding ice,and the static stability in the basic-state atmospheric environment. An important role of the lead width is disclosed (Figure 1 insertion): with increasing widths, the efficiency of the heat/mass transfer first increases and, after achieving a maximum, decreases (Figure 3). Figure 2. Vertical cross sections of the convective wind (arrows) and upward temperature flux (colour shading) after 6 hours of integration. Integrations were started from motionless,stratified states. The ice-water temperature difference was kept constant during the integrations.