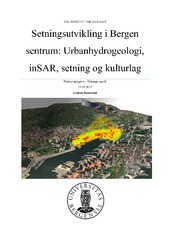
Setningsutvikling i Bergen sentrum: Urbanhydrogeologi, inSAR, setning og kulturlag
Master thesis
Permanent lenke
https://hdl.handle.net/1956/16027Utgivelsesdato
2017-06-09Metadata
Vis full innførselSamlinger
- Department of Geography [627]
Sammendrag
The world heritage site of Bryggen in the mediaeval area of Bergen, Norway, has since the 1990’s been suffering from severe subsidence, caused by reduced pore pressure and oxidation of the organic archeological deposits that form its foundation. To stop subsidence and save the important archeological deposits and the buildings at Bryggen, it is important to understand its spatial extent, and how subsidence is affected by different spatial and climatic factors. This study aims to determine how InSAR remote sensing can be used to measure and map subsidence in the medieval areas of Bergen, Norway. It discusses if InSAR can be used to carry out risk assessments, and how to best present the inSAR data. It also discusses how spatial and climatic variables affect subsidence development. To validate the inSAR dataset, averages from inSAR measurements were compared to the averages from traditional leveling at Bryggen, Schøtstuene and Hanseatisk museum. The results show a difference of less than 1 mm between inSAR and leveling for the three areas. However, because of an error in the InSAR dataset, these results are not good enough to confirm that the inSAR method can measure subsidence down to 1 mm accuracy. Regardless of the error in the inSAR data, the spatial extent of the inSAR measured subsidence and relative subsidence within the inSAR dataset seems accurate. This study shows that the subsidence in the mediaeval areas of Bergen is confined by the extent of the archeological deposits. InSAR data shows that the largest subsidence is taking place at the world heritage site of Bryggen, on the northwestern side of Lungegårdsvannet and in the Vågsbunnen area. It also shows that there is seasonal variations in the subsidence rates. The highest subsidence rates occur during late summer, while the lowest rates occur during winter. This can be explained by seasonal variations observed in local ground water head. The large scale and the high resolution of InSAR makes it suitable for risk mapping, where the most exposed areas are highlighted.
