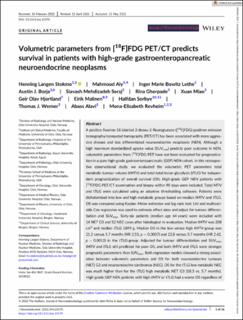
Volumetric parameters from [18F]FDG PET/CT predicts survival in patients with high-grade gastroenteropancreatic neuroendocrine neoplasms
| dc.contributor.author | Langen Stokmo, Henning | |
| dc.contributor.author | Aly, Mahmoud | |
| dc.contributor.author | Lothe, Inger Marie Bowitz | |
| dc.contributor.author | Borja, Austin J. | |
| dc.contributor.author | Seraj, Siavash Mehdizadeh | |
| dc.contributor.author | Ghorpade, Rina | |
| dc.contributor.author | Miao, Xuan | |
| dc.contributor.author | Hjortland, Geir Olav | |
| dc.contributor.author | Malinen, Eirik | |
| dc.contributor.author | Sorbye, Halfdan | |
| dc.contributor.author | Werner, Thomas J. | |
| dc.contributor.author | Alavi, Abass | |
| dc.contributor.author | Rootwelt-Revheim, Mona Elisabeth | |
| dc.date.accessioned | 2023-01-02T10:17:28Z | |
| dc.date.available | 2023-01-02T10:17:28Z | |
| dc.date.created | 2022-09-26T12:17:29Z | |
| dc.date.issued | 2022 | |
| dc.identifier.issn | 0953-8194 | |
| dc.identifier.uri | https://hdl.handle.net/11250/3040245 | |
| dc.description.abstract | A positive fluorine-18 labelled 2-deoxy-2-fluoroglucose ([18F]FDG) positron emission tomography/computed tomography (PET/CT) has been associated with more aggressive disease and less differentiated neuroendocrine neoplasms (NEN). Although a high maximum standardized uptake value (SUVmax) predicts poor outcome in NEN, volumetric parameters from [18F]FDG PET have not been evaluated for prognostication in a pure high-grade gastroenteropancreatic (GEP) NEN cohort. In this retrospective observational study, we evaluated the volumetric PET parameters total metabolic tumour volume (tMTV) and total total lesion glycolysis (tTLG) for independent prognostication of overall survival (OS). High-grade GEP NEN patients with [18F]FDG PET/CT examination and biopsy within 90 days were included. Total MTV and tTLG were calculated using an adaptive thresholding software. Patients were dichotomised into low and high metabolic groups based on median tMTV and tTLG. OS was compared using Kaplan–Meier estimator and log-rank test. Uni and multivariable Cox regression was used to estimate effect sizes and adjust for tumour differentiation and SUVmax. Sixty-six patients (median age 64 years) were included with 14 NET G3 and 52 NEC cases after histological re-evaluation. Median tMTV was 208 cm3 and median tTLG 1899 g. Median OS in the low versus high tMTV-group was 21.2 versus 5.7 months (HR 2.53, p = 0.0007) and 22.8 versus 5.7 months (HR 2.42, p = 0.0012) in the tTLG-group. Adjusted for tumour differentiation and SUVmax, tMTV and tTLG still predicted for poor OS, and both tMTV and tTLG were stronger prognostic parameters than SUVmax. Both regression models showed a strong association between volumetric parameters and OS for both neuroendocrine tumours (NET) G3 and neuroendocrine carcinomas (NEC). OS for the tTLG low metabolic NEC was much higher than for the tTLG high metabolic NET G3 (18.3 vs. 5.7 months). High-grade GEP NEN patients with high tMTV or tTLG had a worse OS regardless of tumour differentiation (NET G3 or NEC). Volumetric PET parameters were stronger prognostic parameters than SUVmax. | en_US |
| dc.language.iso | eng | en_US |
| dc.publisher | Wiley | en_US |
| dc.rights | Navngivelse 4.0 Internasjonal | * |
| dc.rights.uri | http://creativecommons.org/licenses/by/4.0/deed.no | * |
| dc.title | Volumetric parameters from [18F]FDG PET/CT predicts survival in patients with high-grade gastroenteropancreatic neuroendocrine neoplasms | en_US |
| dc.type | Journal article | en_US |
| dc.type | Peer reviewed | en_US |
| dc.description.version | publishedVersion | en_US |
| dc.rights.holder | Copyright 2022 The Author(s) | en_US |
| dc.source.articlenumber | e13170 | en_US |
| cristin.ispublished | true | |
| cristin.fulltext | original | |
| cristin.qualitycode | 1 | |
| dc.identifier.doi | 10.1111/jne.13170 | |
| dc.identifier.cristin | 2055405 | |
| dc.source.journal | Journal of neuroendocrinology | en_US |
| dc.identifier.citation | Journal of neuroendocrinology. 2022, 34 (7), e13170. | en_US |
| dc.source.volume | 34 | en_US |
| dc.source.issue | 7 | en_US |
Tilhørende fil(er)
Denne innførselen finnes i følgende samling(er)
-
Department of Clinical Science [2318]
-
Registrations from Cristin [9791]

Med mindre annet er angitt, så er denne innførselen lisensiert som Navngivelse 4.0 Internasjonal