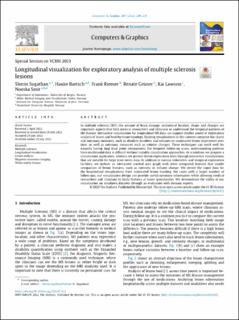
Longitudinal visualization for exploratory analysis of multiple sclerosis lesions
| dc.contributor.author | Sugathan, Sherin | |
| dc.contributor.author | Bartsch, Hauke | |
| dc.contributor.author | Riemer, Frank | |
| dc.contributor.author | Grüner, Eli Renate | |
| dc.contributor.author | Lawonn, Kai | |
| dc.contributor.author | Smit, Noeska Natasja | |
| dc.date.accessioned | 2022-08-12T11:34:32Z | |
| dc.date.available | 2022-08-12T11:34:32Z | |
| dc.date.created | 2022-08-11T13:51:57Z | |
| dc.date.issued | 2022 | |
| dc.identifier.issn | 0097-8493 | |
| dc.identifier.uri | https://hdl.handle.net/11250/3011632 | |
| dc.description.abstract | In multiple sclerosis (MS), the amount of brain damage, anatomical location, shape, and changes are important aspects that help medical researchers and clinicians to understand the temporal patterns of the disease. Interactive visualization for longitudinal MS data can support studies aimed at exploratory analysis of lesion and healthy tissue topology. Existing visualizations in this context comprise bar charts and summary measures, such as absolute numbers and volumes to summarize lesion trajectories over time, as well as summary measures such as volume changes. These techniques can work well for datasets having dual time point comparisons. For frequent follow-up scans, understanding patterns from multimodal data is difficult without suitable visualization approaches. As a solution, we propose a visualization application, wherein we present lesion exploration tools through interactive visualizations that are suitable for large time-series data. In addition to various volumetric and temporal exploration facilities, we include an interactive stacked area graph with other integrated features that enable comparison of lesion features, such as intensity or volume change. We derive the input data for the longitudinal visualizations from automated lesion tracking. For cases with a larger number of follow-ups, our visualization design can provide useful summary information while allowing medical researchers and clinicians to study features at lower granularities. We demonstrate the utility of our visualization on simulated datasets through an evaluation with domain experts. | en_US |
| dc.language.iso | eng | en_US |
| dc.publisher | Elsevier | en_US |
| dc.rights | Navngivelse 4.0 Internasjonal | * |
| dc.rights.uri | http://creativecommons.org/licenses/by/4.0/deed.no | * |
| dc.title | Longitudinal visualization for exploratory analysis of multiple sclerosis lesions | en_US |
| dc.type | Journal article | en_US |
| dc.type | Peer reviewed | en_US |
| dc.description.version | publishedVersion | en_US |
| dc.rights.holder | Copyright 2022 The Author(s) | en_US |
| cristin.ispublished | true | |
| cristin.fulltext | postprint | |
| cristin.fulltext | postprint | |
| cristin.qualitycode | 2 | |
| dc.identifier.doi | 10.1016/j.cag.2022.07.023 | |
| dc.identifier.cristin | 2042452 | |
| dc.source.journal | Computers & graphics | en_US |
| dc.source.pagenumber | 208-2019 | en_US |
| dc.identifier.citation | Computers & graphics. 2022, 107, 208-2019. | en_US |
| dc.source.volume | 107 | en_US |
Tilhørende fil(er)
Denne innførselen finnes i følgende samling(er)
-
Department of Informatics [928]
-
Registrations from Cristin [9791]

Med mindre annet er angitt, så er denne innførselen lisensiert som Navngivelse 4.0 Internasjonal